

Generative UI
When Connie answers with figures, the numbers behind her answer open on a board beside the chat. A board is a set of cards: counts, charts, a map of sites, job lists, finance summaries and more, built from the data Connie looked up. Open a job from the board, filter the list, expand a card, and save the board to come back to it. The Stats dashboard has boards too, under Your views.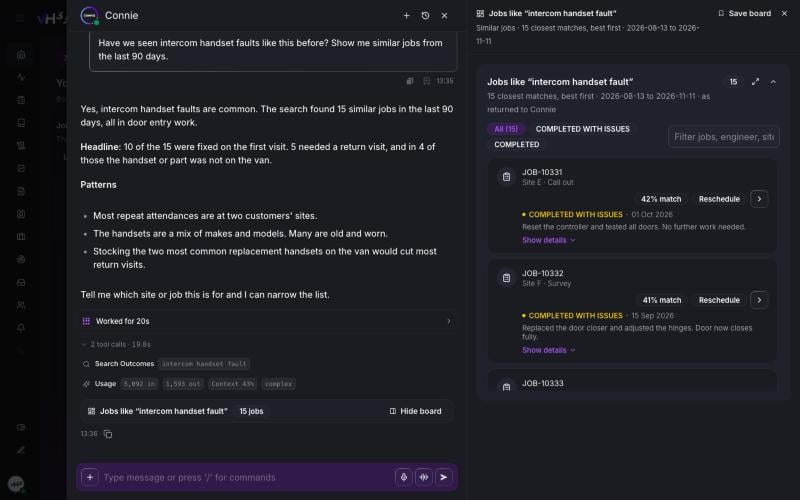
A board beside Connie's answer. Job references, sites and engineers are placeholders.
Boards beside Connie
- Ask Connie a question that needs figures, for example “How did the team do this month?”, “Give me a snapshot of this customer”, or “Have we seen this fault before?”.
- Under her reply, a bar names the board and what is on it, for example 2 KPIs · 1 chart · 12 jobs · map.
- On a wide screen the board opens in a column beside the chat. Choose Hide board or Show board under a reply to switch between boards, and Close board to close the column for this conversation.
- On a narrow screen, and in job and contact chats, the board opens under the reply. Choose Expand board or Collapse board.
Which questions bring a board
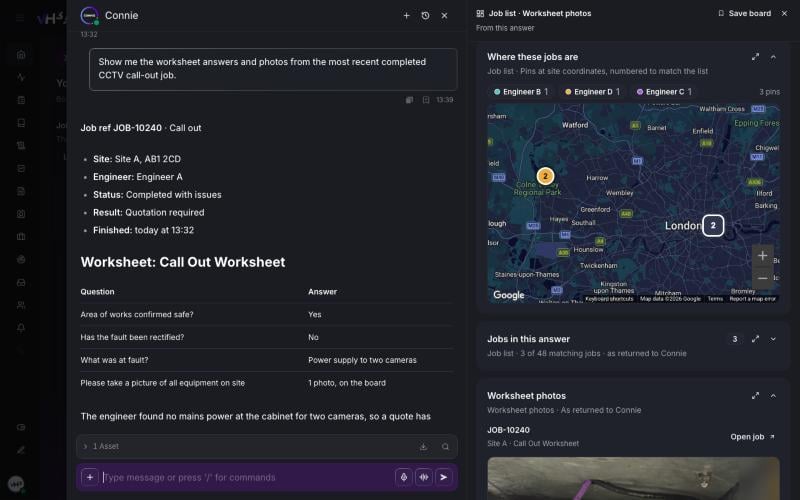
Ask for a job's worksheet and photos: the answer in the chat, the jobs pinned on a map beside it. Job references, sites and engineers are placeholders.
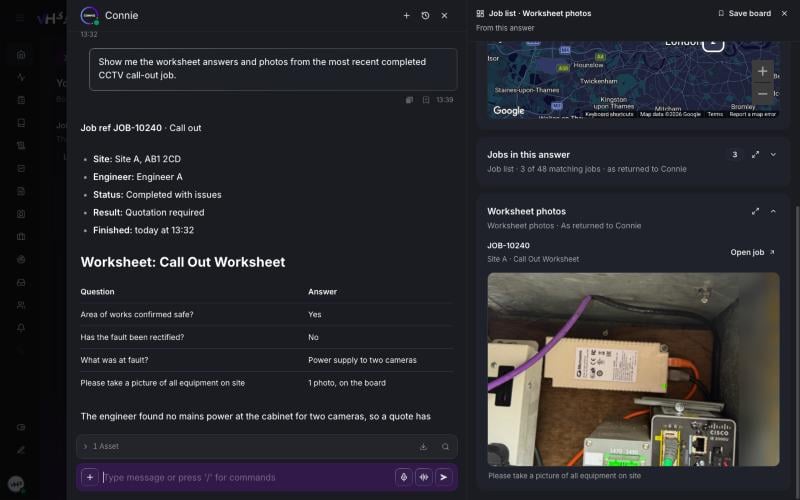
Further down the same board, the worksheet photo with the question it answers. Select the photo to see it full size, or Open job to go to the job.
Boards on the Dashboard
Your views sits at the top of the Stats tab: boards that follow the period and filters above them.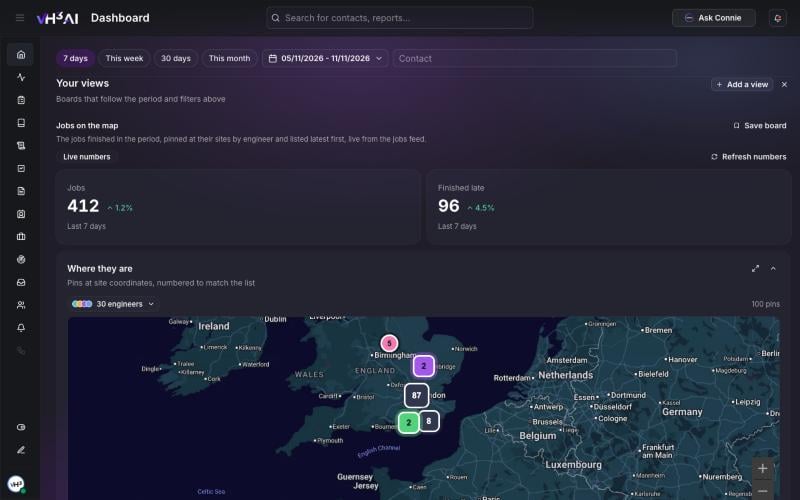
Jobs on the map, a Dashboard preset. Counts are placeholders.
- Open Dashboard and stay on Stats.
- Under Your views, pick a preset, or a board you saved:
- Jobs on the map
- First-time fix next to SLA
- Late jobs and overrun
- Engineer workload
- Outcomes and job types
- Change the period or the contact filter. The board follows.
- Choose Close view when you are done.
Cards you will see
Every card has Expand to open it full size, and a control to fold it away.
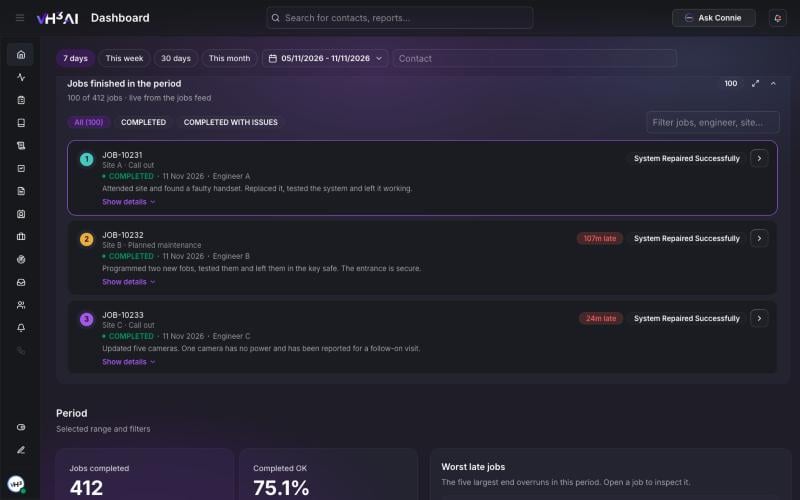
The job list card: filter, expand a row, or open the job. Job references, sites, engineers and notes are placeholders.
Live and fixed cards
- Count tiles, breakdowns and trend charts are live. Choose Refresh numbers to run them again.
- Job lists, reports and finance cards are a copy of what Connie looked up when she answered.
Save a board
- Choose Save board at the top of a board.
- Give it a name, or keep the board’s title, and choose Save.
- Find it under Your views → Saved boards on the Dashboard.
Good to know
- Engineer rankings use operational figures only. Read them alongside what you know about each engineer’s work, and not as grounds for employment decisions.
- Developers who want to build their own cards on VH3 AI data should read the Generative UI guide.